SpeciesDistributionModels.jl

an SDM workflow

Tiem van der Deure

University of Copenhagen

2024-07-12

What are Species Distribution Models?

From: conservationbytes.com

  • Use occurrence records and environmental variables
  • Predict where a species can live

What are Species Distribution Models?

  • The main way to understand how climate change will affect nature
  • A huge field of research with:
    • Common standards
    • Recurring problems
    • Often-used data sources

Current tools for SDMs

  • Heavily reliant on R with dozens of R packages
  • Pros:
    • Very complete
    • Beginner-friendly
    • Documented
  • Cons:
    • Slow
    • Not custumisable
    • Idiosyncratic syntax

Towards SDMs in Julia

  • JuliaGeo
    • E.g. Rasters.extract
  • Models
    • E.g. Maxnet
    • PRs to MLJ
  • SpeciesDistributionModels.jl
    • Depends on MLJ and Rasters
    • Aims to make Julia machine learning tools accessible for SDM users

A typical SDM workflow

  • Load environmental data
  • Load occurrence data
  • Data wrangling
  • Fit a model ensemble
  • Evaluate the ensemble
  • Predict

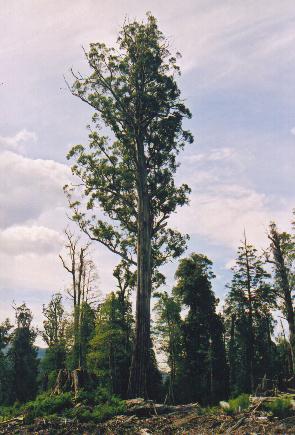
Eucalyptus regnans

Environmental data


using Rasters, RasterDataSources, ArchGDAL, NaturalEarth, DataFrames
bio = RasterStack(WorldClim{BioClim}, (1,12))
countries = naturalearth("ne_10m_admin_0_countries") |> DataFrame
australia = subset(countries, :NAME => ByRow(==("Australia"))).geometry
bio_aus = Rasters.trim(mask(bio; with = australia)[X = 110 .. 156, Y = -45 .. -10])
╭─────────────────────╮
│ 244×198 RasterStack │
├─────────────────────┴────────────────────────────────────────────────── dims ┐
  ↓ X Projected{Float64} LinRange{Float64}(113.00000000000001, 153.49999999999997, 244) ForwardOrdered Regular Intervals{Start},
  → Y Projected{Float64} LinRange{Float64}(-10.833333333333337, -43.666666666666664, 198) ReverseOrdered Regular Intervals{Start}
├────────────────────────────────────────────────────────────────────── layers ┤
  :bio1  eltype: Float32 dims: X, Y size: 244×198
  :bio12 eltype: Float32 dims: X, Y size: 244×198
├────────────────────────────────────────────────────────────────────── raster ┤
  extent: Extent(X = (113.00000000000001, 153.66666666666663), Y = (-43.666666666666664, -10.666666666666671))
  missingval: -3.4f38
  crs: GEOGCS["WGS 84",DATUM["WGS_1984",SPHEROID["WGS 84",6378137,298.257223563,AUTHORITY["EPSG","7030"]],AUTHORITY["EPSG","6326"]],PRIMEM["Greenwich",0,AUTHORITY["EPSG","8901"]],UNIT["degree",0.0174532925199433,AUTHORITY["EPSG","9122"]],AXIS["Latitude",NORTH],AXIS["Longitude",EAST],AUTHORITY["EPSG","4326"]]
└──────────────────────────────────────────────────────────────────────────────┘

Environmental data

using CairoMakie
Rasters.rplot(bio_aus)

Occurrence data

using GBIF2, SpeciesDistributionModels
sp = species_match("Eucalyptus regnans")
occurrences_raw = occurrence_search(sp; year = (1970,2000), country = "AU", hasCoordinate = true, limit = 2000)
occurrences = thin(occurrences_raw.geometry, 5000)
220-element Vector{Tuple{Real, Float64}}:
 (145.98298, -38.33349)
 (146.35, -37.36667)
 (146.24194, -38.52083)
 (146.3225, -38.48833)
 (146.45583, -38.46889)
 (146.741424, -42.886531)
 (145.61944, -37.71861)
 (146.502222, -42.360093)
 (143.9438, -38.55351)
 (146.64194, -38.38778)
 ⋮
 (145.96639, -37.43278)
 (147.983333, -41.433333)
 (147.9333, -37.4833)
 (148.36806, -37.38167)
 (146.483333, -42.55)
 (146.95, -43.283333)
 (147.966667, -42.45)
 (147.5, -37.4)
 (147.15, -42.983333)

Background points

using StatsBase
bg_indices = sample(findall(boolmask(bio_aus)), 500)
bg_points = DimPoints(bio_aus)[bg_indices]
fig, ax, pl = plot(bio_aus.bio1)
scatter!(ax, occurrences; color = :red)
scatter!(ax, bg_points; color = :grey)
fig

Handling data

using SpeciesDistributionModels
p_data = extract(bio_aus, occurrences; skipmissing = true)
bg_data = bio_aus[bg_indices]
data = sdmdata(p_data, bg_data; resampler = CV(nfolds = 3))
SDMdata object with  presence points and  absence points. 
 
Resampling: 
Data is divided into 3 folds using resampling strategy CV(nfolds = 3, …).
┌──────┬─────────┬────────┐
│ fold │ # train │ # test │
├──────┼─────────┼────────┤
│    1 │     479 │    240 │
│    2 │     479 │    240 │
│    3 │     480 │    239 │
└──────┴─────────┴────────┘
Predictor variables: 
┌───────┬────────────┬─────────┐
│ names │ scitypes   │ types   │
├───────┼────────────┼─────────┤
│ bio1  │ Continuous │ Float32 │
│ bio12 │ Continuous │ Float32 │
└───────┴────────────┴─────────┘
Does not contain geometry data

Fitting an ensemble

using Maxnet: MaxnetBinaryClassifier
using EvoTrees: EvoTreeClassifier
using MLJGLMInterface: LinearBinaryClassifier
models = (
  maxnet = MaxnetBinaryClassifier(),
  brt = EvoTreeClassifier(),
  glm = LinearBinaryClassifier()
)

ensemble = sdm(data, models)
trained SDMensemble, containing 9 SDMmachines across 3 SDMgroups 

Uses the following models:
maxnet => MaxnetBinaryClassifier. 
brt => EvoTreeClassifier. 
glm => LinearBinaryClassifier. 

Evaluating an ensemble

import SpeciesDistributionModels as SDM
ev = SDM.evaluate(ensemble; measures = (; auc, accuracy))
SpeciesDistributionModels.SDMensembleEvaluation with 2 performance measures
train
┌──────────┬──────────┬──────────┐
│    model │      auc │ accuracy │
│      Any │  Float64 │  Float64 │
├──────────┼──────────┼──────────┤
│   maxnet │ 0.992211 │  0.97009 │
│      brt │ 0.999617 │ 0.990956 │
│      glm │ 0.985032 │ 0.964527 │
│ ensemble │ 0.998119 │ 0.988174 │
└──────────┴──────────┴──────────┘
test
┌──────────┬──────────┬──────────┐
│    model │      auc │ accuracy │
│      Any │  Float64 │  Float64 │
├──────────┼──────────┼──────────┤
│   maxnet │ 0.989113 │ 0.970758 │
│      brt │ 0.979693 │ 0.958252 │
│      glm │ 0.985132 │  0.96798 │
│ ensemble │ 0.986692 │ 0.962424 │
└──────────┴──────────┴──────────┘

Predicting

pred = SDM.predict(ensemble, bio_aus; reducer = mean)
plot(pred; colorrange = (0,1))

Understanding the model

expl = SDM.explain(ensemble; method = ShapleyValues(8))
interactive_response_curves(expl)

What is next for SDMs in Julia?

  • SpeciesDistributionModels.jl is early stage
  • We have:
    • Easy interfacing with many models through MLJ
    • Easy access to raster data and operations
  • We need:
    • Documentation and tutorials
    • All commonly used tools (e.g. GAMs)
    • Very intuitive and consistent syntax